Bound Images
Bound Images as Linked Open Data: Examples from the Works of Erwin Raisz
by Lena Denis
In a recent exhibition at the Harvard Map Collection, I included The Pattern of World Agriculture, a map made by geographer Erwin Raisz, based on the research of one of his Harvard geography colleagues, D.S. Whittlesey. The map uses pictorial symbols to show major regional crops of the world (Figure 1).
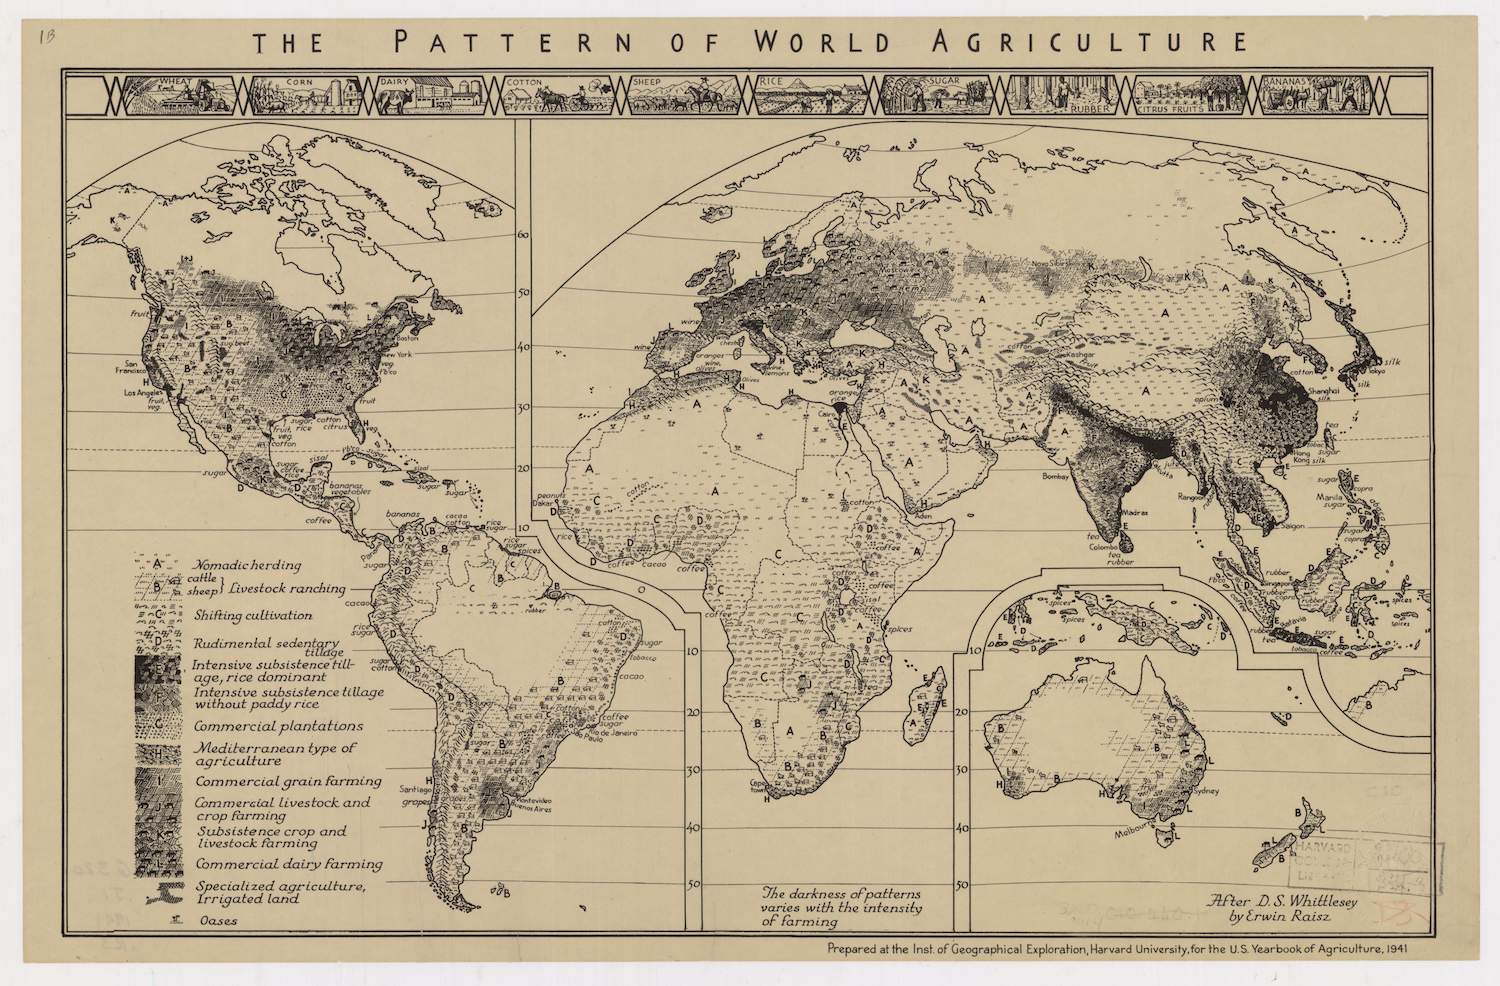
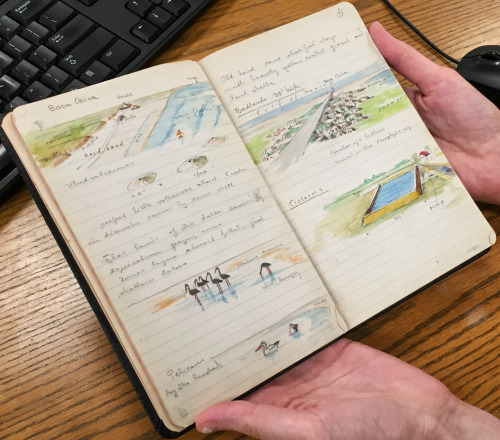
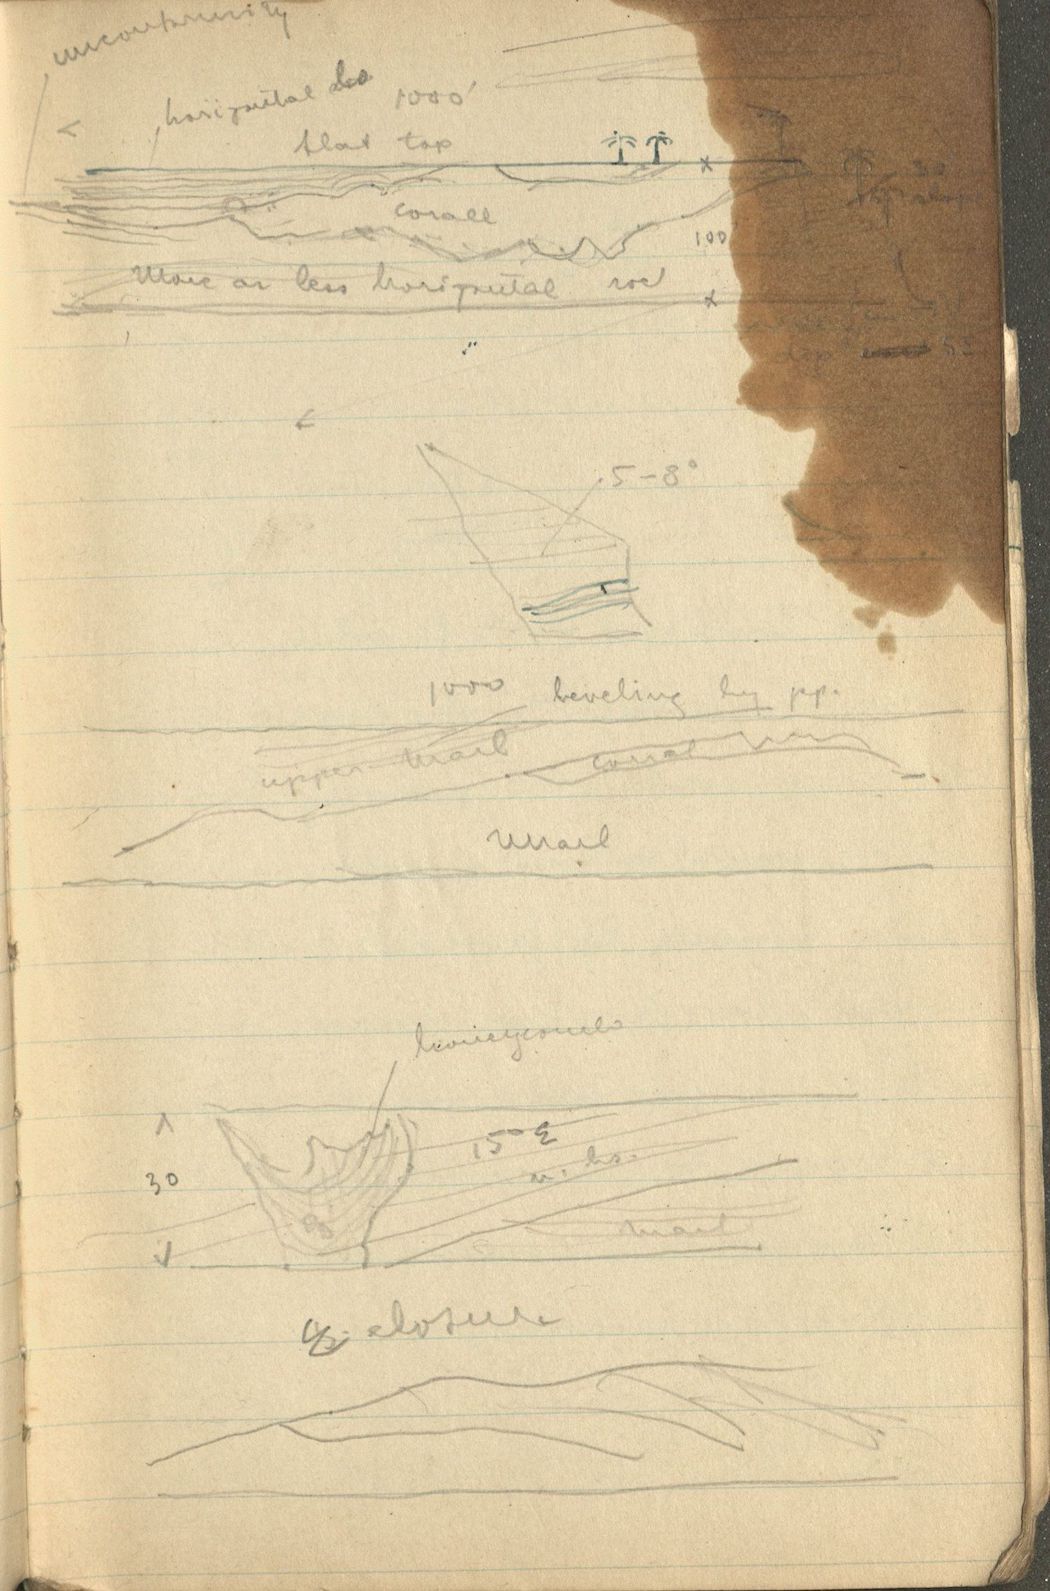
A note on the bottom right says that it was prepared for the 1941 U.S. Yearbook of Agriculture – part of a short-lived government series of farming manuals. To my surprise, the copies of the Yearbook I found included maps made by Whittlesey, but not this map or any other by Raisz. I never discovered the reason for this discrepancy, but a clue may be the stylistic difference between his map and the images that did appear in the volume. Unlike the shading-reliant government maps, which use numbers, lines, and circles for statistical notations, Raisz covered his map in neatly drawn pictorial symbols, arranged by densities and sizes to show statistical variation. He was a polymath, a trained architectural draftsman and geologist who wrote the first English-language textbook of cartographic history, General Cartography (1938). His travel field notebooks combine the aesthetic of an artist’s sketchbook with that of a geometry problem set (Figures 2 & 3).
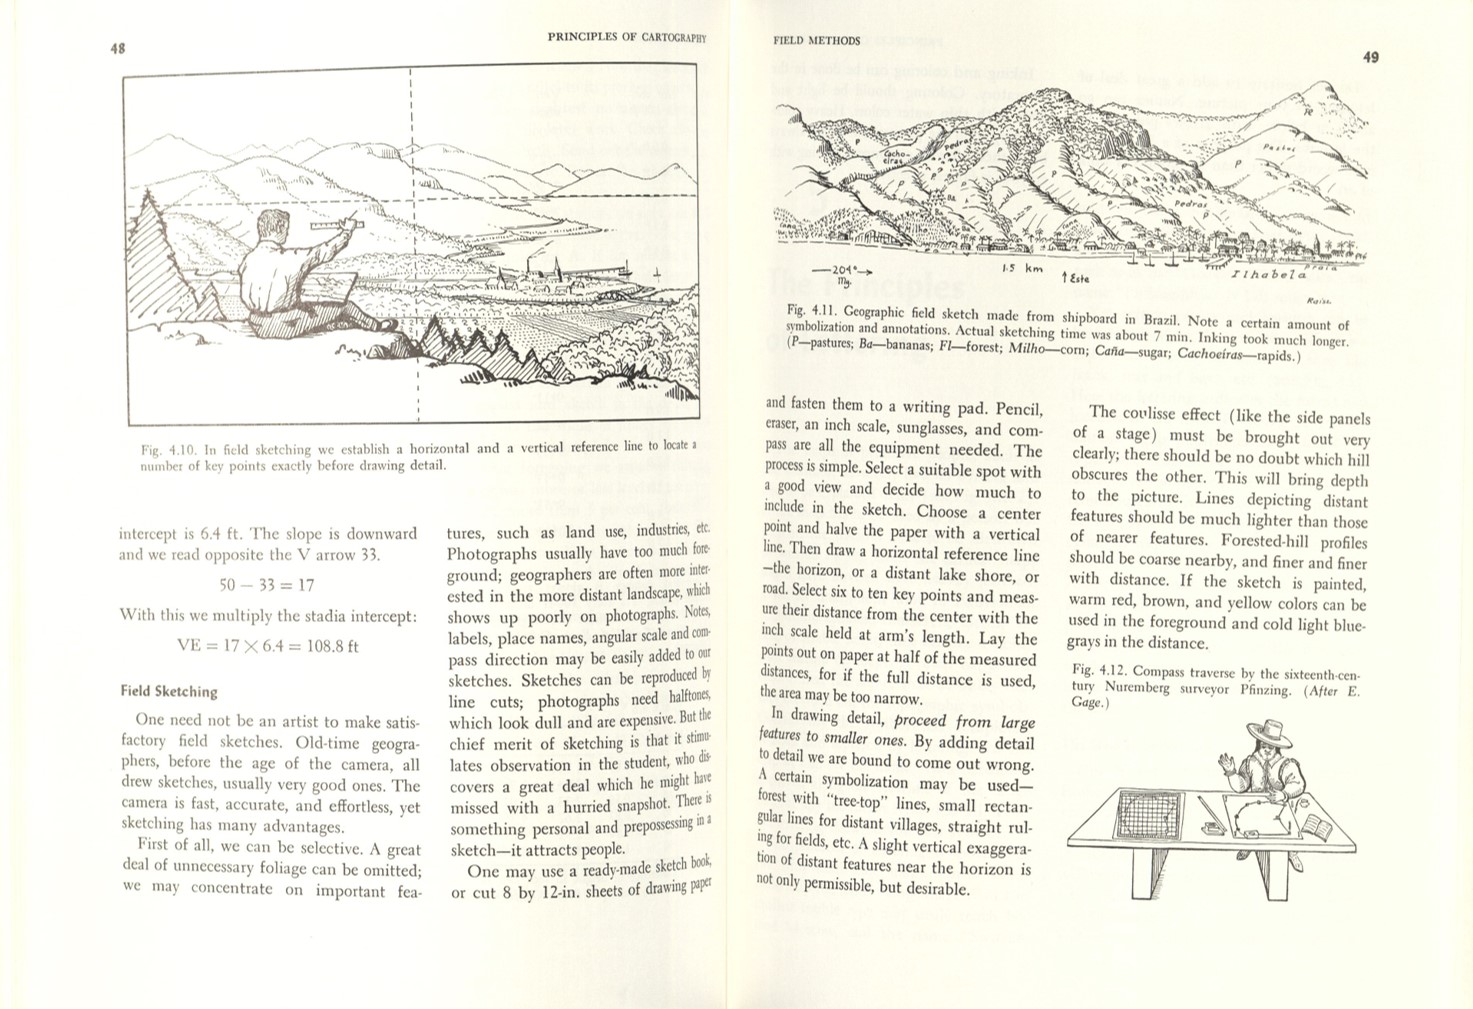
Further investigating Raisz’ published works revealed that, far from being hampered by creative constraints, he actually adapted this unique cartographic style for a wide variety of publications. Some were completely his own, including General Cartography, his later instruction manuals, and other textbooks about regionally-specific geography. Illustrations and diagrams peppered his writing on these topics, giving a visual demonstration of how he understood the world (Fig. 4). Quite often, his maps were actually published as the illustrations to other writers’ works, whether for historic or scientific textbooks, or even children’s books. Looking more carefully at examples of how Raisz combined map and illustration, I realized that many of them already looked familiar to me, because I had seen them in draft form in his field notebooks.
With all this in mind, a larger question emerged: should the many maps of Erwin Raisz be considered bound or unbound images? Whether standalone publications supposedly meant for book inclusions that never happened, ghostly drafts in the corners of notebook pages that became massive atlases, or map-related illustrations of a written argument – how do these images depend on or determine the books that did or did not include them? Rather than trying to answer this question myself, I attempted to visualize it a different way, using a popular Linked Open Data ontology called Wikidata to bind the disbound map images with their origin documents, and to separate the bound images for close scrutiny.
Wikidata stores the structured data that runs its sister Wikimedia Foundation projects, including the much more famous Wikipedia. It is an open-licensed form of Linked Data, which is defined by the World Wide Web Consortium as a collection of interrelated datasets on the Web, connected through subject-predicate-object (RDF) statements with their relationships clearly defined. (1) Linked Data can deliver virtually any information across the Internet to a user who searches for it, because it is machine-readable, translatable between human languages, and possible to query using Web standards. I decided to use Wikidata to experiment with a bound and disbound map and book combination from Raisz’s career that continues to mesmerize researchers to this day: the Atlas de Cuba.
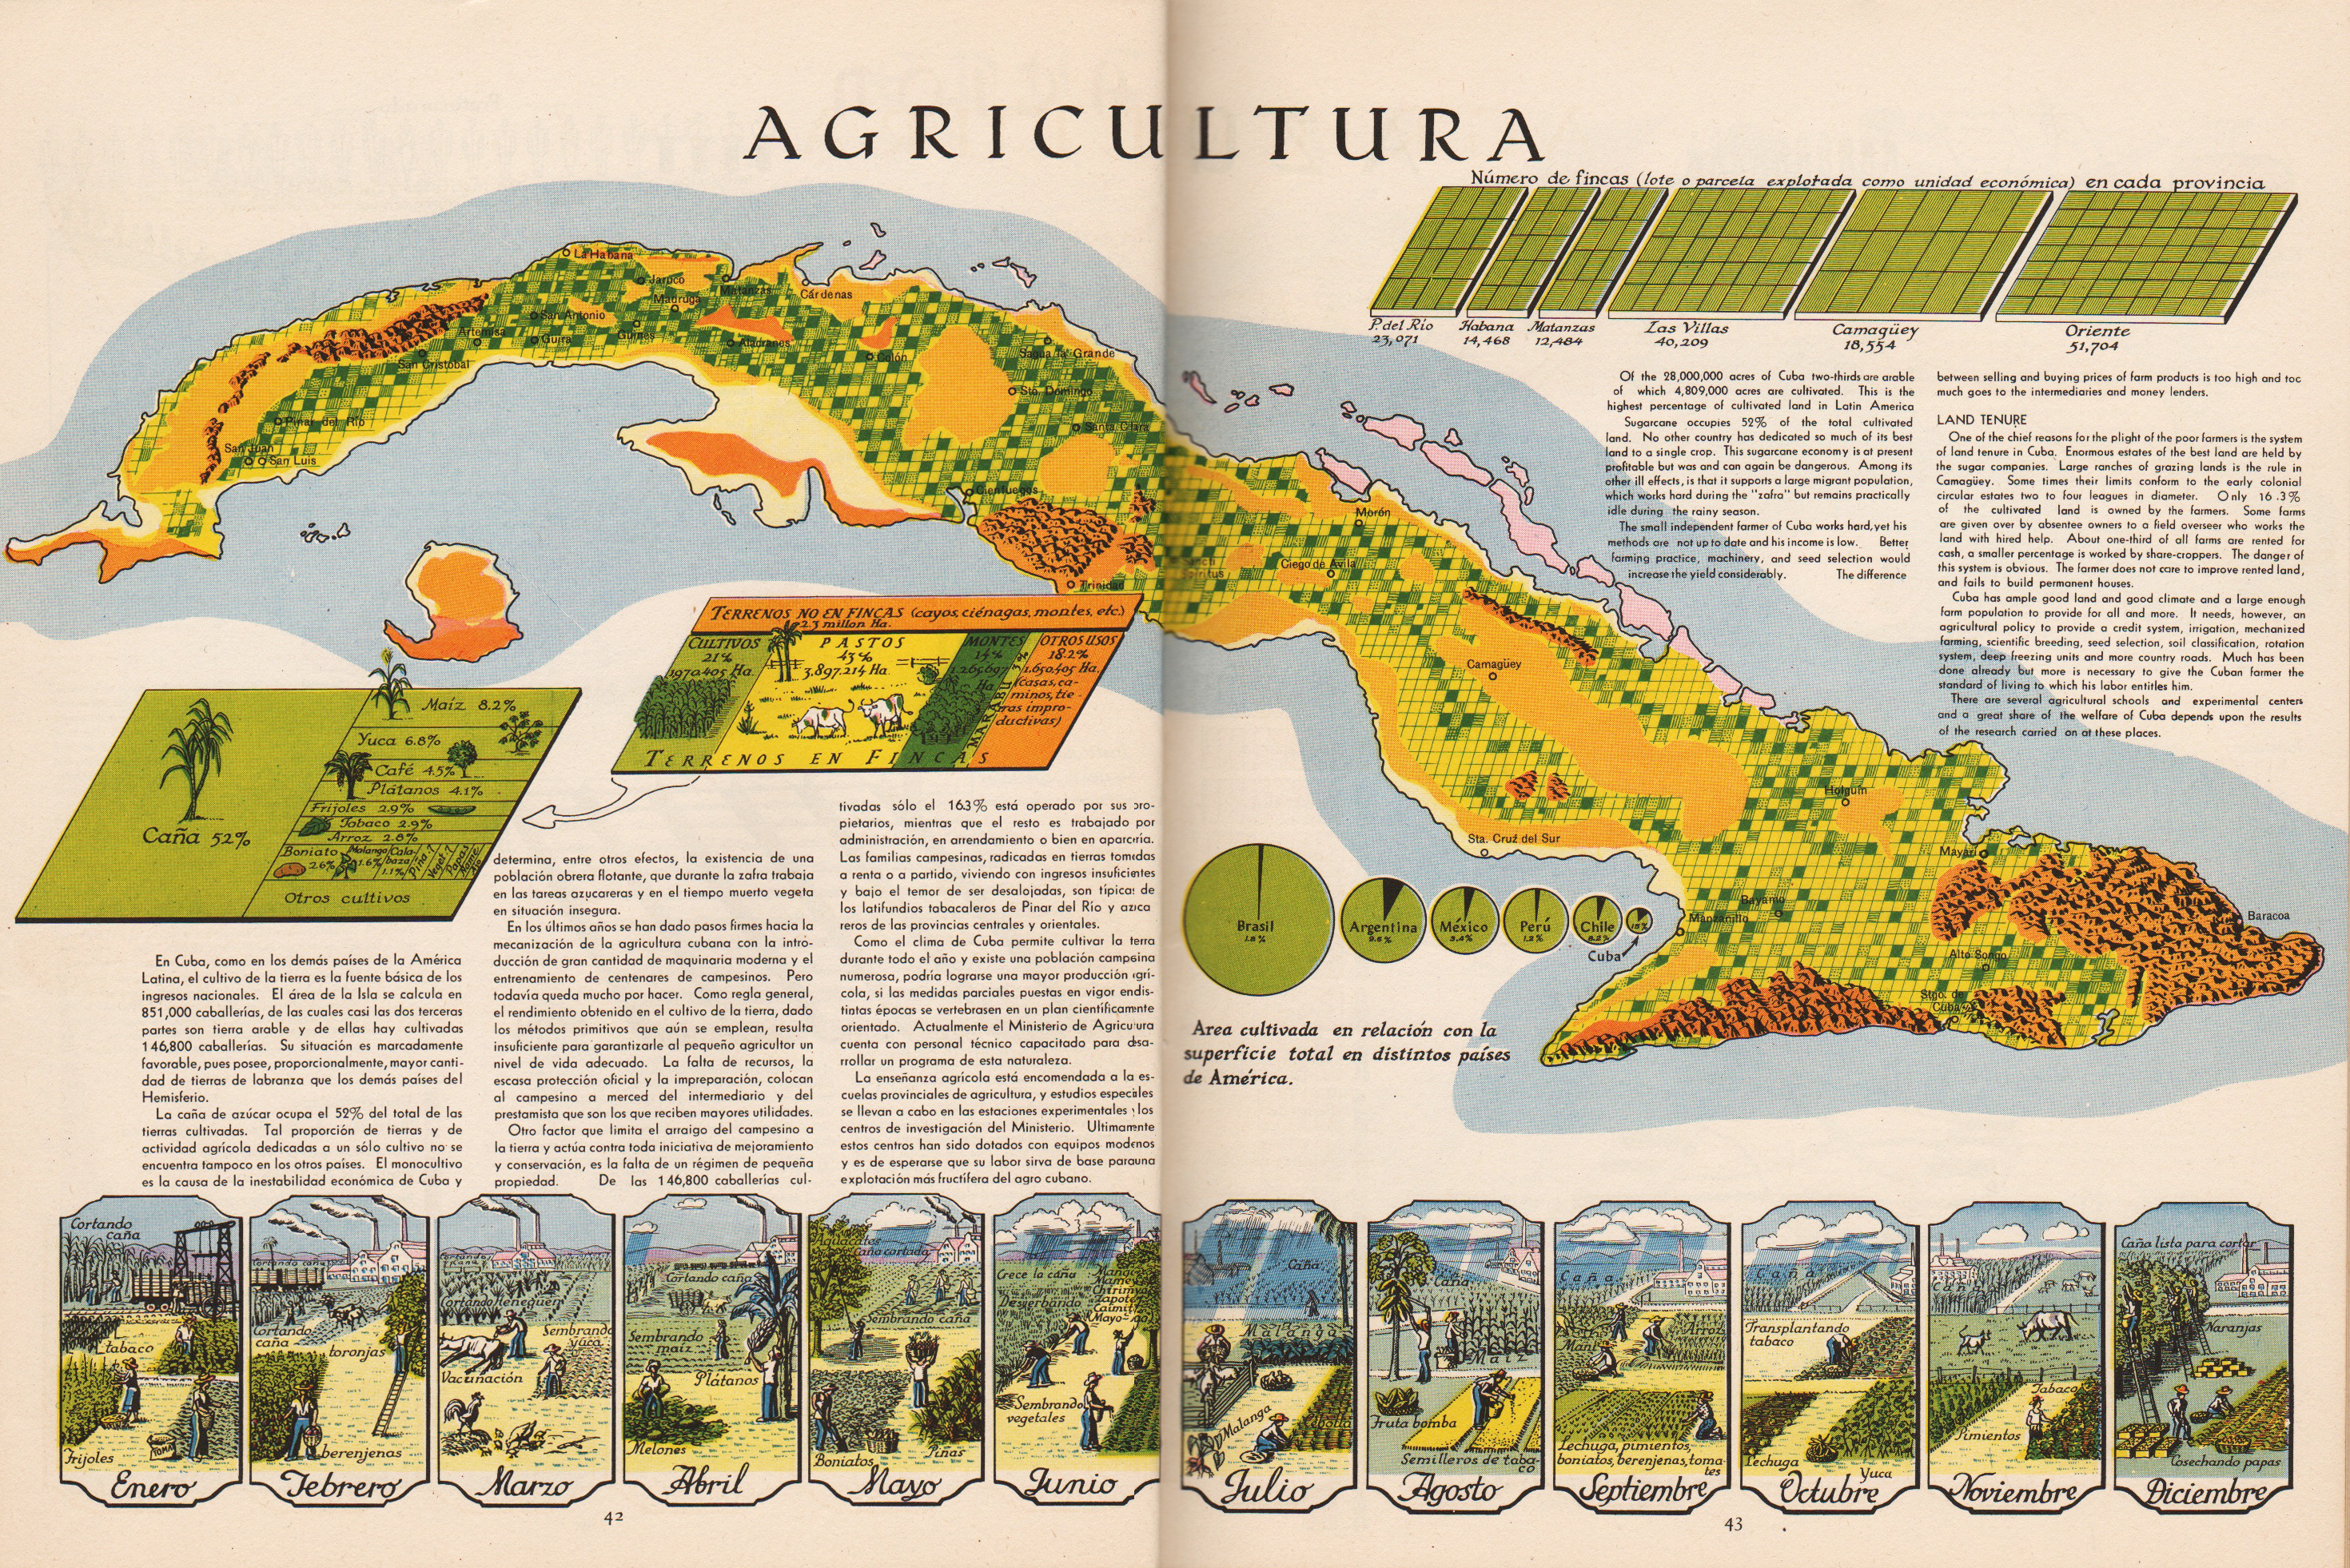
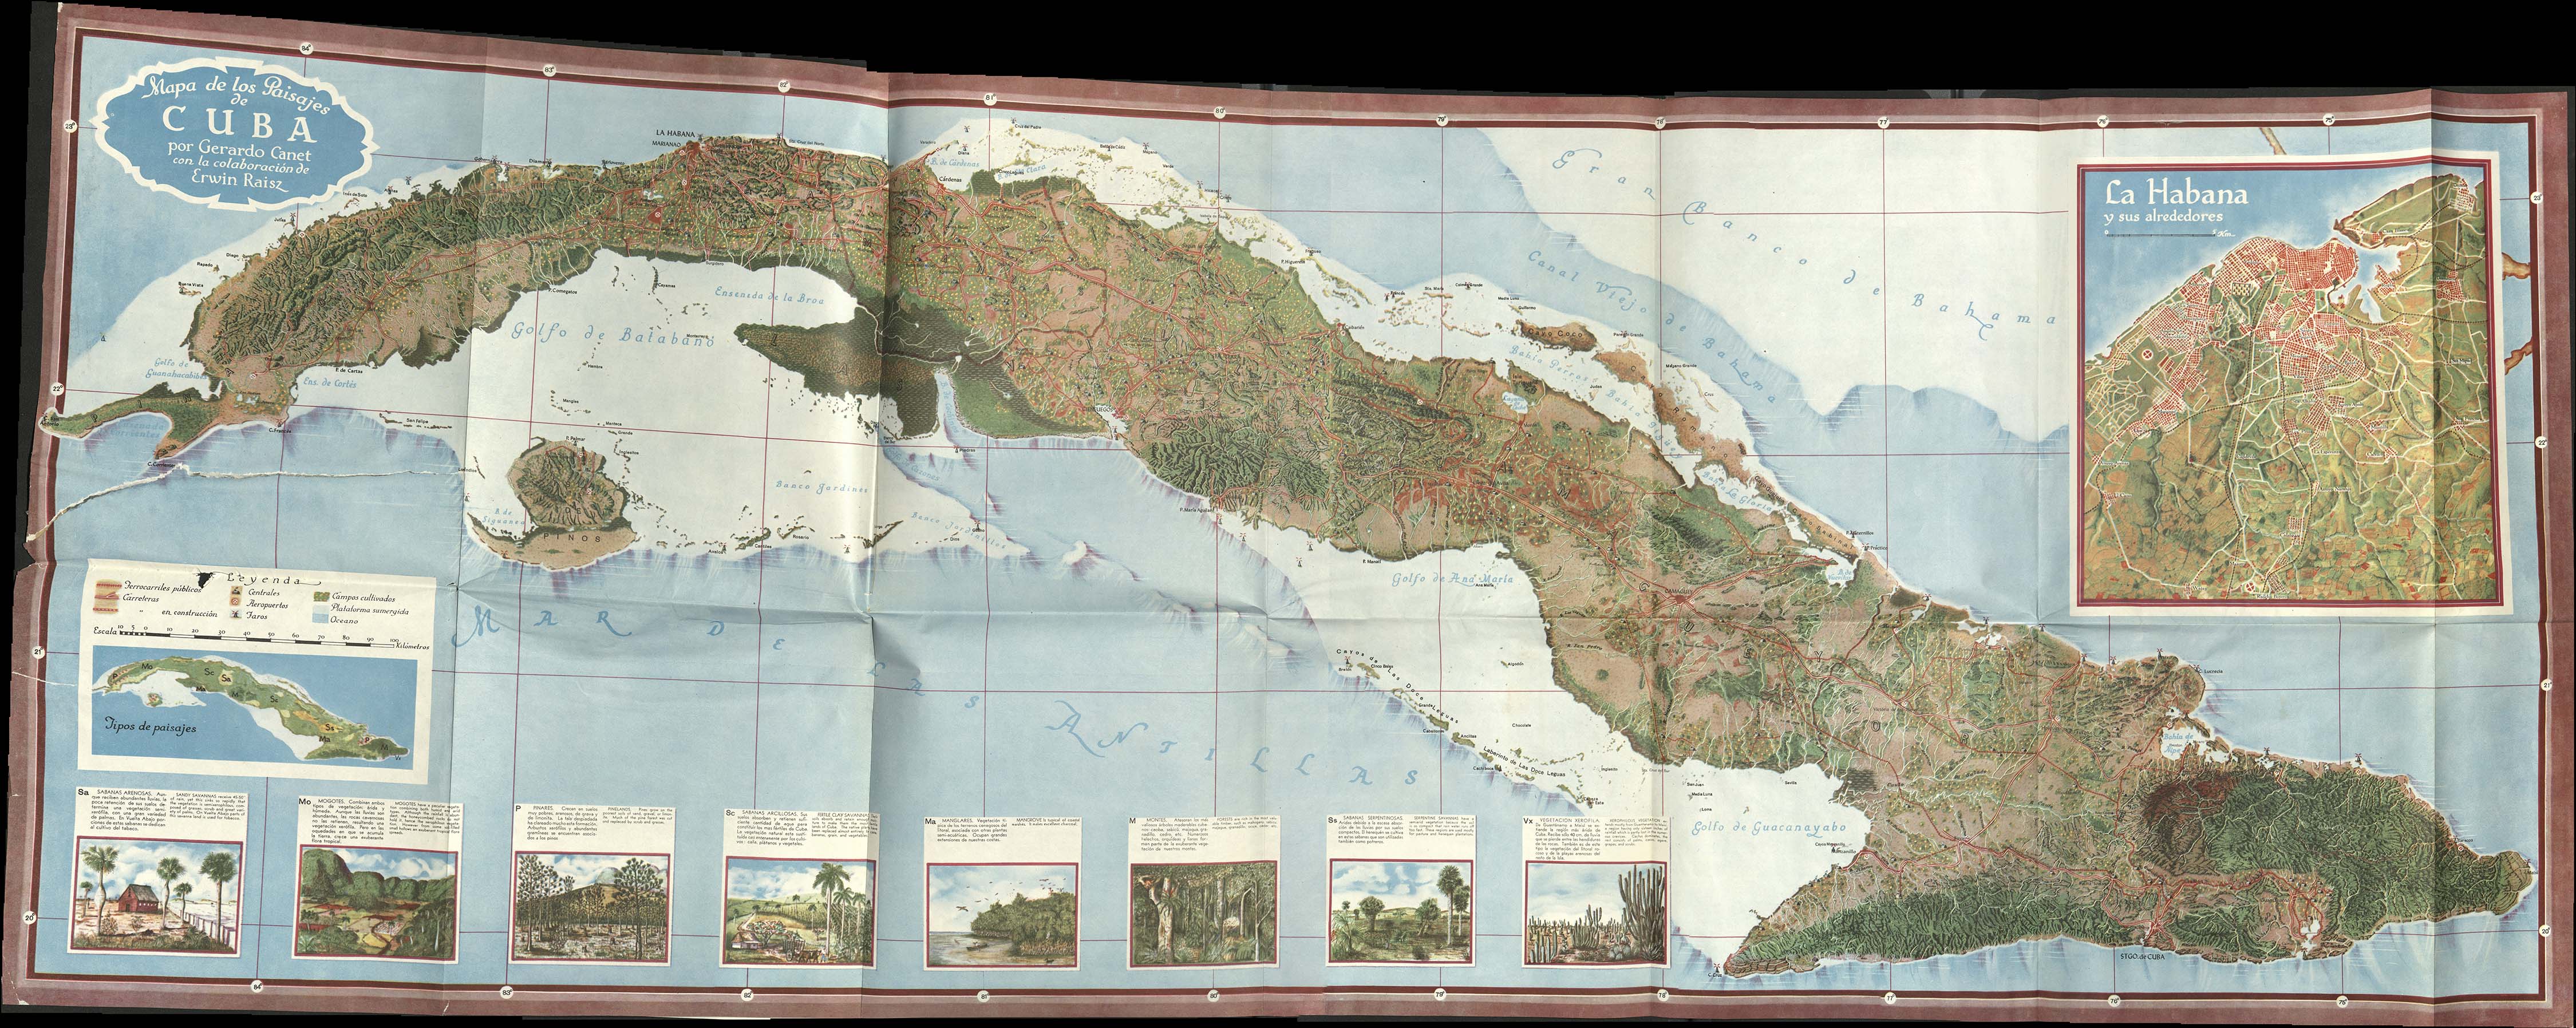
In 1949, Raisz contributed maps and illustrations for the publication of the atlas, working with Cuban geographer Gerardo Canet (Fig. 5). The text was Canet’s, and he is listed as author. The book, however, is imbued with Raisz’s sense of human geography. His minuscule illustrations can be found on every page, in details that are sometimes more whimsical than scientific, a far cry from the American agriculture book. The images support every word of the text, and some are “sovereign” images, such as the massive Mapa de los Paisajes de Cuba (Figure 6). The map was issued with the atlas in a pocket, but its legend and corresponding illustrated insets, which describe the country’s regions with words and images, make it a self-contained information document. If a viewer found a copy of the map separate from the atlas – as many libraries would catalog it – the points about Cuba’s national and regional geography would still be understandable even without the full text.
By considering an author’s individual materials and other elements within (and between) library collections as interrelated datasets, the interdependence of images within a given text and across an entire body of work can be less a question of process, and more an opportunity for information visualization. I modeled this relationship in Wikidata, giving the various parts of the atlas their unique attributes, but also showing how they work together with the notebook drafts that made them possible. In the first example, when the arrows are clicked to expand, the query visualization starting with Cuba reveals the two major works about Cuba that Raisz contributed to, and where in his notebooks the research illustrations and text for them can be found (Figure 7). The result is more visually connected and easier to navigate than an archival finding aid, and it doesn’t require the connection to be made by a researcher who has never seen the notebooks. This is especially important in mid-20th-century cases due to copyright restrictions that prevent complete digitization of an author’s works, let alone the financial or time investments required to do so. The same result can be seen in graph form, with the connections made linearly instead of hierarchically (Figure 8).
Many more queries can be made and visualized, but a final example of interest for this point is another hierarchical list, this time showing all works of Erwin Raisz with notebook precedents (Figure 9). While there are many reasons someone might want to consult his archival notebooks, this visualization connects them to published works that may be individual maps sheets or map-containing books, which may themselves be interconnected. Thus, the ambiguity of determining whether a map is sovereign from its book remains an interesting philosophical question, but it does not have to be a practical limitation.
By connecting these examples through Linked Data, maps and books that might normally be separated, whether by a librarian, a collector, or even by the will of their creator, can be reunited or united for the first time. Their ‘sovereignty’ is determined by their innate features expressed as data, rather than by the container in which they are found or stored.
__________
(1) W3C. Linked Data. Retrieved March 22, 2019, from https://www.w3.org/standards/semanticweb/data